
Eviction Risk Score
Very High
#2
of 30 AK counties
4.1 / 10
#2 of 30 counties in Alaska for landlord eviction risk.
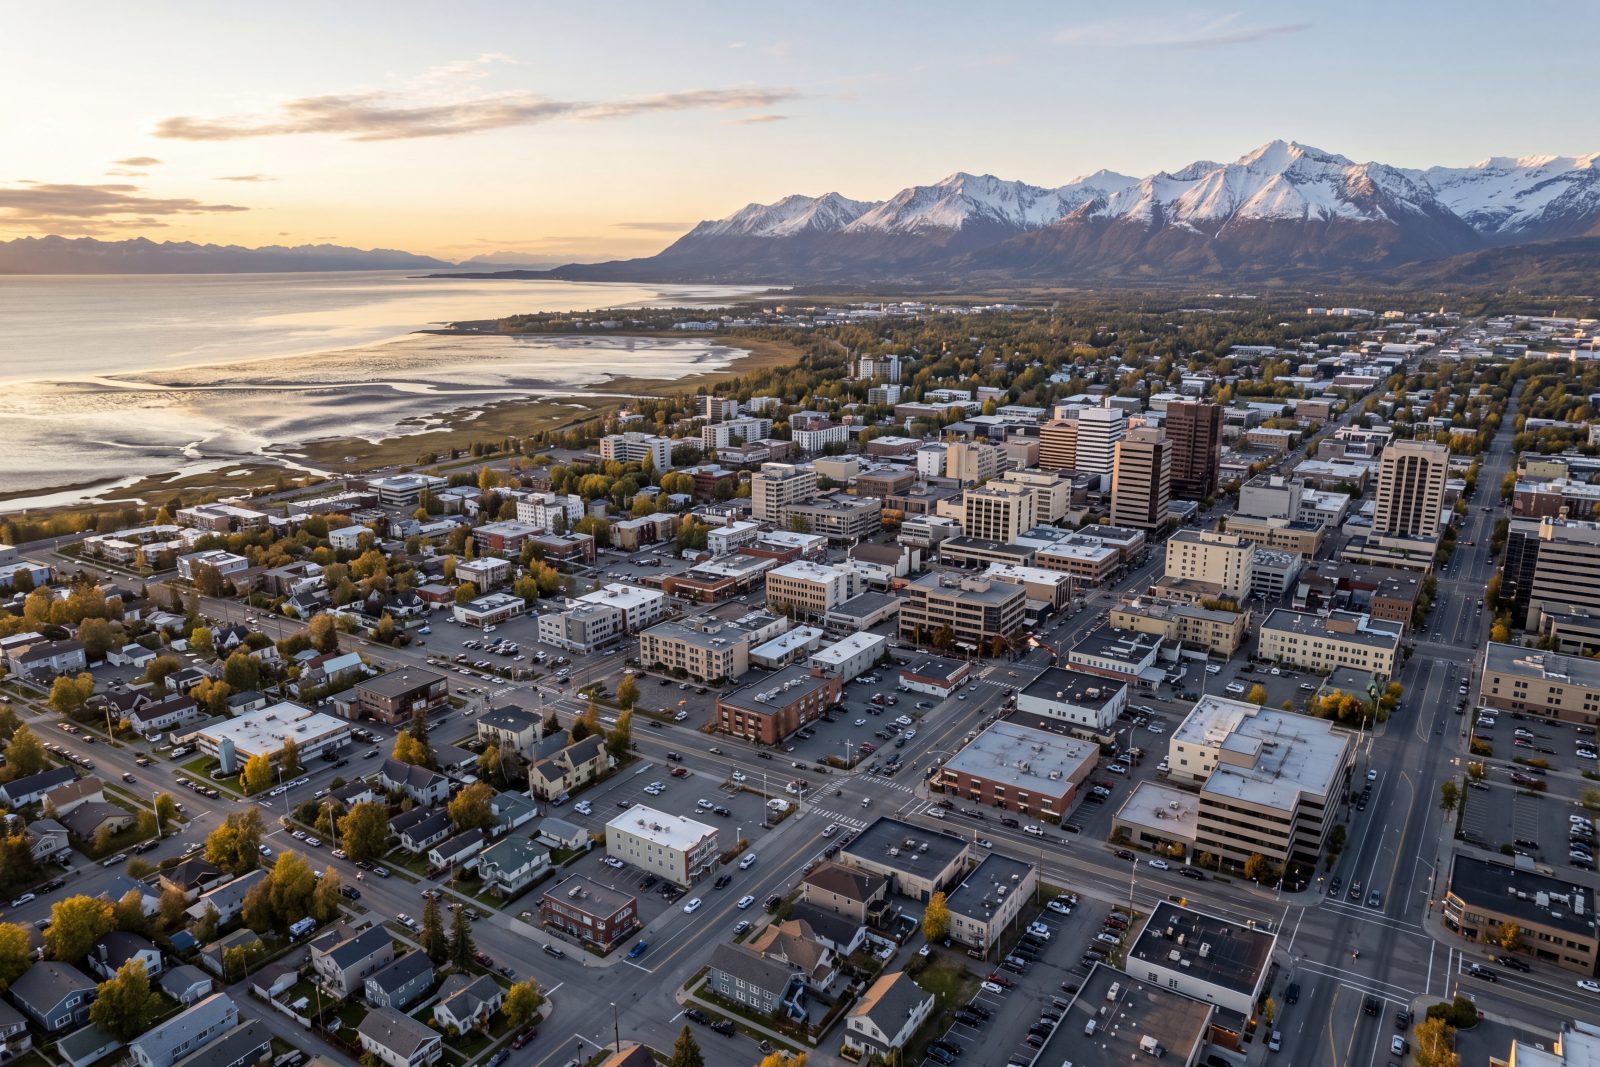
35 incorporated cities and unincorporated areas. The county Eviction Risk Score is held aloft by the city of Bethel (7.9) and a small number of dense urban cores. Rent-control coverage varies by city.
Ranked #2 of 30 AK counties
18k residents · 35 cities · 3 tracts
Bethel Census Area averages 4.3/10 (Low risk) across 35 cities, with scores spanning 3.1 to 7.9; the highest-risk community, Crooked Creek, reaches the county maximum of 7.9/10. Ranked 19th of 30 Alaska counties by eviction risk, placing Bethel Census Area in the middle third of the state.
| City↕ | Population↕ | Risk↕ | % income on rent↕ | Average rent↕ | Lean↕ | |
|---|---|---|---|---|---|---|
| 001 | Bethel | 6,312 | 4.3 | 18.8% | $1,678 | - |
| 002 | Quinhagak | 1,311 | 3.6 | 16.3% | $869 | - |
| 003 | Kwethluk | 975 | 4.0 | 15.0% | $725 | - |
| 004 | Toksook Bay | 833 | 4.0 | 27.5% | $750 | - |
| 005 | Akiachak | 736 | 4.5 | 14.7% | $708 | - |
| 006 | Kipnuk | 706 | 4.0 | 22.5% | $838 | - |
| 007 | Kasigluk | 698 | 3.6 | 12.3% | $719 | - |
| 008 | Chefornak | 620 | 3.4 | 12.1% | $825 | - |
| 009 | Nunapitchuk | 618 | 3.8 | 36.1% | $1,303 | - |
| 010 | Aniak | 585 | 4.2 | 19.6% | $1,313 | - |
| 011 | Napakiak | 556 | 6.6 | 51.0% | $1,708 | - |
| 012 | Kwigillingok | 545 | 3.7 | 11.9% | $553 | - |
| 013 | Tuntutuliak | 514 | 3.9 | 19.5% | $1,188 | - |
| 014 | Napaskiak | 447 | 4.0 | 15.4% | $1,268 | - |
| 015 | Tununak | 384 | 4.0 | 19.5% | $1,188 | - |
| 016 | Akiak | 377 | 4.0 | 9.0% | $492 | - |
| 017 | Kongiganak | 316 | 3.6 | 27.5% | $825 | - |
| 018 | Mekoryuk | 287 | 3.4 | 15.3% | $615 | - |
| 019 | Upper Kalskag | 239 | 4.0 | 14.7% | $685 | - |
| 020 | Lower Kalskag | 239 | 3.7 | 19.5% | $700 | - |
| 021 | Eek | 174 | 4.1 | 19.5% | $1,188 | - |
| 022 | Tuluksak | 118 | 4.1 | 9.0% | $505 | - |
| 023 | Goodnews Bay | 115 | 3.2 | 19.5% | $1,188 | - |
| 024 | Nightmute | 93 | 3.2 | 19.5% | $1,188 | - |
| 025 | Atmautluak | 88 | 4.6 | 19.5% | $1,188 | - |
| 026 | Chuathbaluk | 82 | 4.2 | 19.2% | $1,458 | - |
| 027 | Sleetmute | 48 | 3.6 | 19.5% | $1,188 | - |
| 028 | Platinum | 43 | 3.1 | 19.5% | $1,188 | - |
| 029 | Oscarville | 42 | 4.6 | 19.5% | $1,188 | - |
| 030 | Newtok | 36 | 4.0 | 19.5% | $1,188 | - |
| 031 | Stony River | 29 | 4.0 | 19.5% | $1,188 | - |
| 032 | Crooked Creek | 17 | 7.9 | 19.5% | $1,188 | - |
| 033 | Mertarvik | 12 | 3.1 | 19.5% | $1,188 | - |
| 034 | Lime Village | 9 | 3.2 | 19.5% | $1,188 | - |
| 035 | Red Devil | 3 | 3.1 | 19.5% | $1,188 | - |
Bethel Census Area carries a county-wide average eviction-risk score of 4.1/10 (Low), placing it 19th out of 30 Alaska counties, meaning 18 counties statewide score higher and only 11 score lower. For landlords and investors, that middle-of-the-pack position translates to a market where baseline tenant-payment stress and regulatory pressure are modest by Alaska eviction laws standards, yet far from absent. With 35 cities spread across a total population of roughly 18,198, the census area covers remote YK-Delta communities where rental demand is concentrated and options for tenants are limited, a dynamic that generally supports steady occupancy but also means collections and evictions must be handled with care in tight-knit communities.
Average rent across the census area sits at $1,188 per month, and the average rent-burden rate of 19.5% of income is comparatively manageable, suggesting tenants are not, on average, stretched dangerously thin. Even so, a 24.3% poverty rate and a renter share of 35.7% of households signal that a meaningful portion of the rental pool operates with little financial cushion. Landlords should price and screen accordingly rather than assuming low risk scores mean effortless collections.
Risk inside the census area is genuinely hyper-local, spanning from 1.5 at the low end to 2.8 at the high end. The ceiling is shared by Akiachak (4.5/10, population 736) and Napakiak (6.6/10), the two highest-risk communities in the area. Close behind are Toksook Bay (4/10, population 833), Kipnuk (4/10, population 706), and Aniak (4.2/10). These villages combine higher poverty exposure with smaller tenant pools, making any eviction both operationally difficult and socially visible.
At the other end of the spectrum, Kasigluk (3.6/10) and Quinhagak (3.6/10, population 1,311) represent the lowest-risk operating environments within the census area. The largest community, Bethel, scores 4.3/10 with a population of 6,312, making it the regional hub with the deepest rental market and the most predictable landlord-tenant dynamics. Investors evaluating specific villages should treat individual city scores as the primary input rather than relying on the county average alone.
All landlord-tenant relationships in Bethel Census Area are governed by Alaska eviction laws Stat. § 34.03 (Uniform Residential Landlord and Tenant Act). Notice requirements are straightforward: 7 days for non-payment of rent, 10 days for a lease violation with opportunity to cure, and 30 days for end-of-term or no-cause termination. Alaska eviction laws does not require just cause to terminate a tenancy, and there is no statewide rent control or rent-cap formula in effect. The Alaska eviction laws eviction process runs 25 to 40 days when uncontested and 50 to 100 days when a tenant contests the action. Understanding the full Alaska eviction costs matters before committing to a remote property: court filing fees run $150 to $250, sheriff lockout fees add $50 to $200, and attorney fees typically range from $500 to $2,500 depending on case complexity.
Alaska security deposit limits and Alaska tenant protections also deserve review before finalizing any lease in the census area. Landlords must give 24 hours notice before entering a unit under Alaska eviction laws Stat. § 34.03, and retaliation against tenants is prohibited by Alaska Stat. § 34.03.310. Fair housing complaints are handled by the Alaska State Commission for Human Rights. Source-of-income is not a protected class under Alaska state law as of the last review date of May 29, 2026.
With a poverty rate of 24.3% and renters making up 35.7% of households, financial fragility is unevenly distributed across the census area's 35 cities; the city grid above breaks down individual scores so you can identify which communities carry the most concentrated risk before committing capital.
In August 2025, 1 eviction filings were recorded in Bethel Census Area, 33.3% of the historical average (below average).1
From 2007 to 2016, eviction filings in Bethel Census Area declined 21%. The peak was 19 filings in 2007.2
Data covers 2000–2018, the full span of the Princeton Eviction Lab's national county court-records dataset.
Bethel Census Area's average eviction risk score of 4.3/10 sits in the middle of its peer group: Nome Census Area (4.1/10), Northwest Arctic Borough (4.1/10), and Chugach Census Area (4.1/10) all score higher, while Prince of Wales-Hyder Census Area (4.1/10) scores lower and Yukon-Koyukuk Census Area (4.1/10) is tied.
Within Alaska, Bethel Census Area ranks 19th of 30 counties by eviction risk (rank 1 is the highest-risk county), placing it in the middle third of the state: 18 counties carry more risk and 11 are less risky.