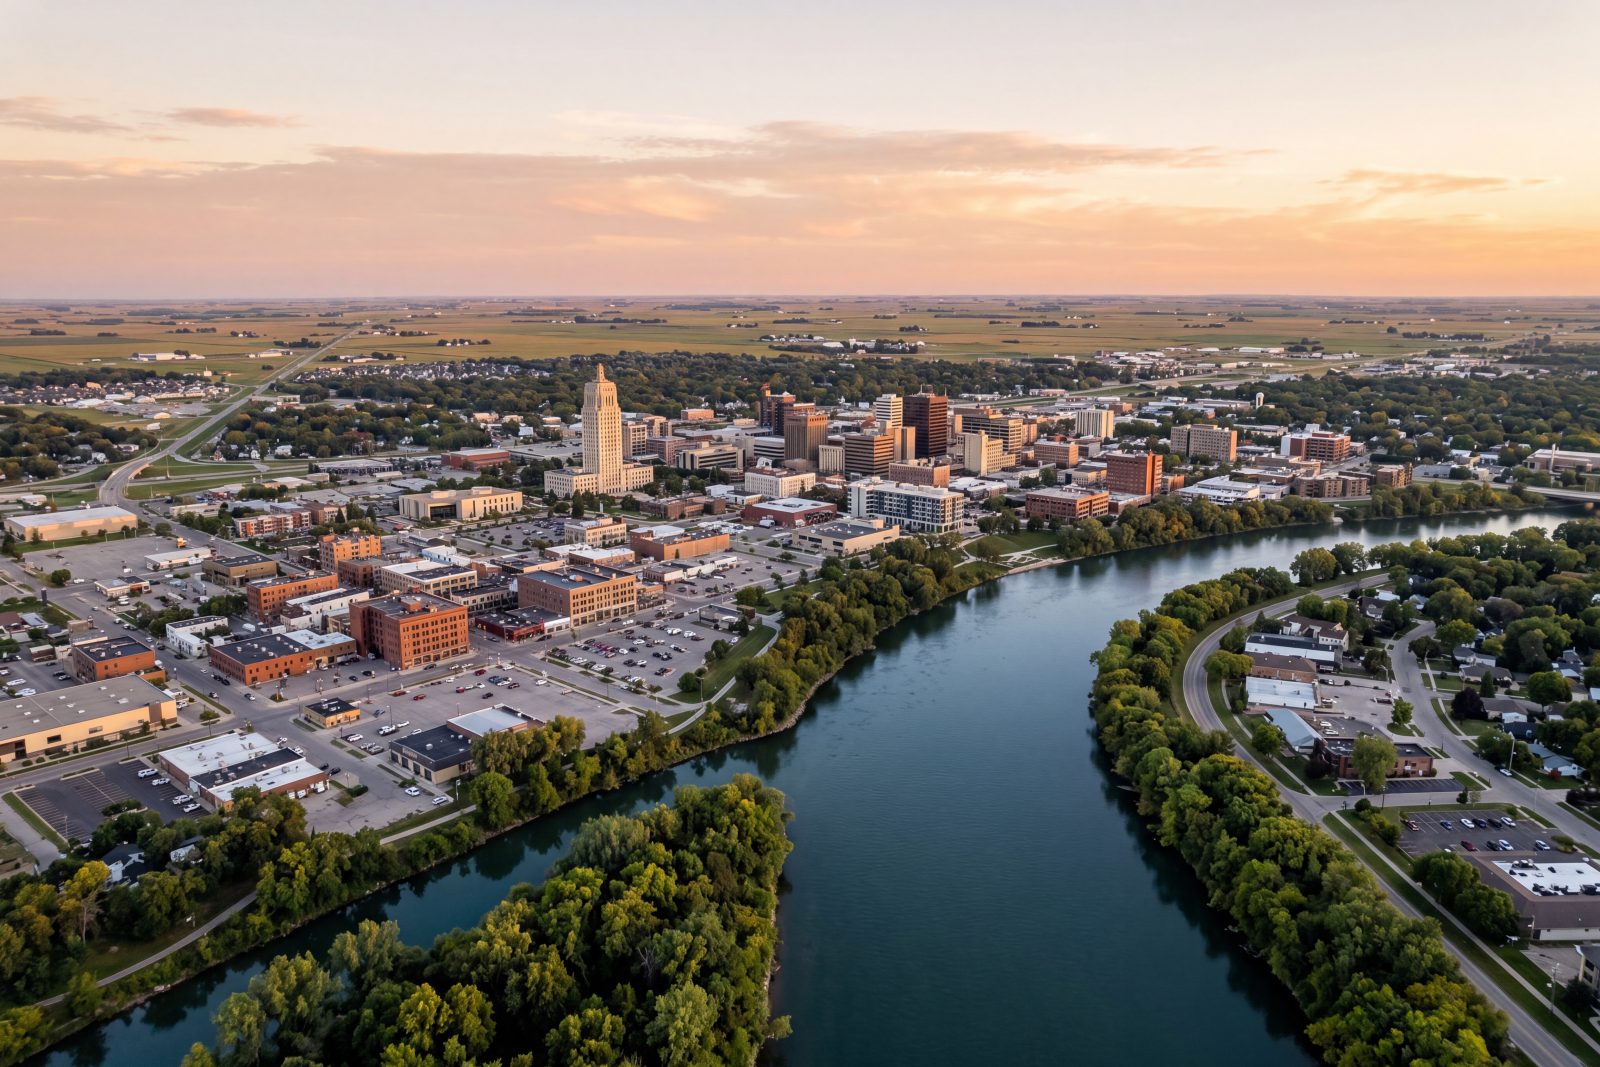
Burleigh County, North Dakota Eviction Risk: Very Low
8 incorporated cities and unincorporated areas. The county Eviction Risk Score is held aloft by the city of Bismarck (2.4) and a small number of dense urban cores. Rent-control coverage varies by city.
In 2026
Risk score
1.7
VERY LOW
Ranked #45 of 53 ND counties
81k residents · 8 cities · 19 tracts
1976–2026 · pop-weighted from cities
Burleigh County eviction risk score history
Min1.7Average2.4Now1.7
197619861996200620162026
Key metrics
Tenant beats landlord
3.7%
/ 100 outcomes
In court-decided eviction outcomes for Burleigh County, ND, tenants prevail in roughly 3.7% of contested cases. A higher number means landlords face stronger tenant defenses and longer calendars.
Timeline
20d
filing → judgment
From the moment an unlawful-detainer notice is filed in Burleigh County, ND until a money judgment is entered, a contested eviction takes about 20 days on average. Longer timelines mean more lost rent for landlords.
Cost range
$0.7–2.7k
legal + lost rent
A typical eviction in Burleigh County, ND costs landlords $728 to $2,720 all-in, covering court filing fees, process-server costs, attorney time, and lost rent.
Average rent
$994
24% stretched on rent
Average gross rent in Burleigh County, ND is $994 per month per the U.S. Census American Community Survey. 24% of renter households here spend more than 30% of pre-tax income on rent.
Renters
32.9%
of households
32.9% of occupied housing units in Burleigh County, ND are renter-occupied. A higher renter share usually correlates with more eviction filings and a more active rental market.
Poverty
9.5%
3.5% unemp.
9.5% of Burleigh County, ND residents live below the federal poverty line, and unemployment runs at 3.5%. Both feed the economic-stress sub-score in our Eviction Risk Score model.
Time machine
Scrub 50 years
197619861996200620162026
2026
● LIVE · today◀ REPLAY · historical
Burleigh County's average eviction-risk score is 1.7/10, with individual cities ranging from 1.7/10 (Bismarck) to 1.7/10 (Wilton, the highest-risk city in the county). Ranked 47 of 53 North Dakota counties by risk, 46 counties are riskier than Burleigh County.
How Burleigh County ranks in North Dakota
Lower number means more extreme, where #1 is the most
Eviction Risk Score
Very Low
#45of 53 ND counties1.7 / 10
#45 of 53 counties in North Dakota for landlord eviction risk.
Cost of living
Very Low
#44of 51 states (statewide)89.0 index
North Dakota ranks #44 of 51 states on overall cost of living (11.0% cheaper than the U.S. avg).
Housing services cost
Low
#39of 51 states (statewide)71.4 index
North Dakota ranks #39 of 51 states on housing services (28.6% cheaper than the U.S. avg).
Income spent on rent
Elevated
#22of 53 ND counties23.3% of income
#22 of 53 counties in North Dakota on % of income spent on rent.
Burleigh County scores 1.7/10 on the EvictionRiskMap scale, earning a Low risk rating across all 8 cities in the county. That places it at rank 47 of 53North Dakota eviction laws counties, meaning 46 counties carry higher eviction risk and only 6 are less risky than Burleigh. For landlords and investors, this is one of the most operationally stable corners of North Dakota eviction laws, anchored by a state legal framework that moves relatively quickly and imposes no local rent controls.
The intra-county spread runs from 1.7/10 at the floor to 1.6/10 at the top, a tight band that reflects consistent conditions rather than sharp pockets of distress. Average rent across the county sits at $994, with an average rent burden of 24.4% of income, a figure that stays comfortably below the threshold where tenants routinely fall behind. With a 32.9% renter share and a 9.5% average poverty rate, the tenant base here is predominantly working, which supports timely rent collection and limits the chronic delinquency patterns that drive up risk scores in tighter markets.
The cities inside Burleigh County
Bismarck, the county seat and by far its largest city at 75,556 residents, scores 1.7/10, the lowest risk in the county. That is where the overwhelming majority of the county's rental inventory is concentrated, and those landlords are operating in as calm an environment as this state offers. Lincoln, at 4,381 residents, scores 1.7/10, still well within the Low band but a notch above Bismarck eviction risk, reflecting somewhat different tenant demographics in the suburban fringe.
The highest-risk locations are small. Apple Valley, with a population of 607, scores 2.4/10, the county's peak, followed by Wing at 1.4/10 (population 207). These are rural communities where a single troubled property can move aggregate statistics, but even their scores signal low absolute risk. The point for investors is that risk is hyper-local even within a low-risk county: the city-level pages above show which specific markets warrant closer scrutiny before acquiring rental units.
State-level laws that apply here
North Dakota state law under N.D.C.C. § 47-16 (Leasing of Real Property) gives landlords efficient tools. Non-payment of rent triggers a 3-day notice, and lease-violation cure notices are also 3 days. End-of-tenancy no-cause termination requires 30 days. Uncontested evictions resolve in 21 to 40 days; contested cases run 45 to 100 days. The North Dakota eviction laws eviction process is materially faster than what landlords face in most coastal or high-regulation states. Court filing fees run $75 to $150, sheriff lockout fees add $40 to $125, and attorney fees typically range from $500 to $2,500 depending on case complexity. A thorough breakdown of those expenses appears in the guide to North Dakota eviction costs.
No just-cause requirement applies under state law, meaning landlords can exit month-to-month tenancies without stating a reason beyond the 30-day notice. There is no rent cap formula and no local rent-control ordinance, because North Dakota eviction laws state law preempts municipalities from enacting rent control. That combination of fast notice timelines, no just-cause mandate, and no rent ceiling is the legal foundation that keeps Burleigh County scores at the bottom of the risk scale. The North Dakota security deposit limits and the full scope of North Dakota tenant protections are covered in the statewide guides linked throughout this site.
With a 9.5% average poverty rate and 32.9% of households renting, Burleigh County's tenant base is stable relative to most U.S. markets, and the city-by-city grid above shows exactly where within the county the modest variation in risk is concentrated.
Reviewed by the NextGen Properties Research Team. North Dakota statute information is current as of 2026-05-29, based on N.D.C.C. § 47-16 (Leasing of Real Property). Risk scores are derived from ACS 2023 5-year estimates, Burleigh County court eviction timelines, and 2024 county-level presidential voting margins.
Eviction filings in Burleigh County
In June 2025, 3 eviction filings were recorded in Burleigh County, 14.1% of the historical average (below average).1
3Jun 2025
14.1%of historical avg
11,476Renter households
8.2%Poverty rate
Last 24 months of filings2023-07 – 2025-06
Historical eviction filings in Burleigh County
From 2000 to 2016, eviction filings in Burleigh County increased 296%.
The peak was 214 filings in 2016.2
542000
214Peak (2016)
2142016
Annual filings 2000–2016No filing data published after 2018
Data covers 2000–2018, the full span of the Princeton Eviction Lab's national county court-records dataset.
Within the state, Burleigh County ranks 47 of 53North Dakota eviction laws counties by eviction risk, placing it in the lower-risk third of the state where only 6 counties are less risky, making it one of the most landlord-favorable acquisition markets in North Dakota eviction laws.
Peer counties in North Dakota
Same state, closest by population and Eviction Risk Score
How is the Burleigh County eviction risk score computed?
Each of the 8 cities in the county is independently scored on nine sub-factors. The county-wide 1.7/10 average reflects a population-weighted mean of those municipal scores.
Q2
Does Burleigh County have rent control?
Rent control is determined by state law and city ordinance. North Dakota state framework applies. See the North Dakota eviction laws rent-control guide for details.
Q3
What is the political climate in Burleigh County?
Burleigh County voted Republican by 40.2 points in 2020.